
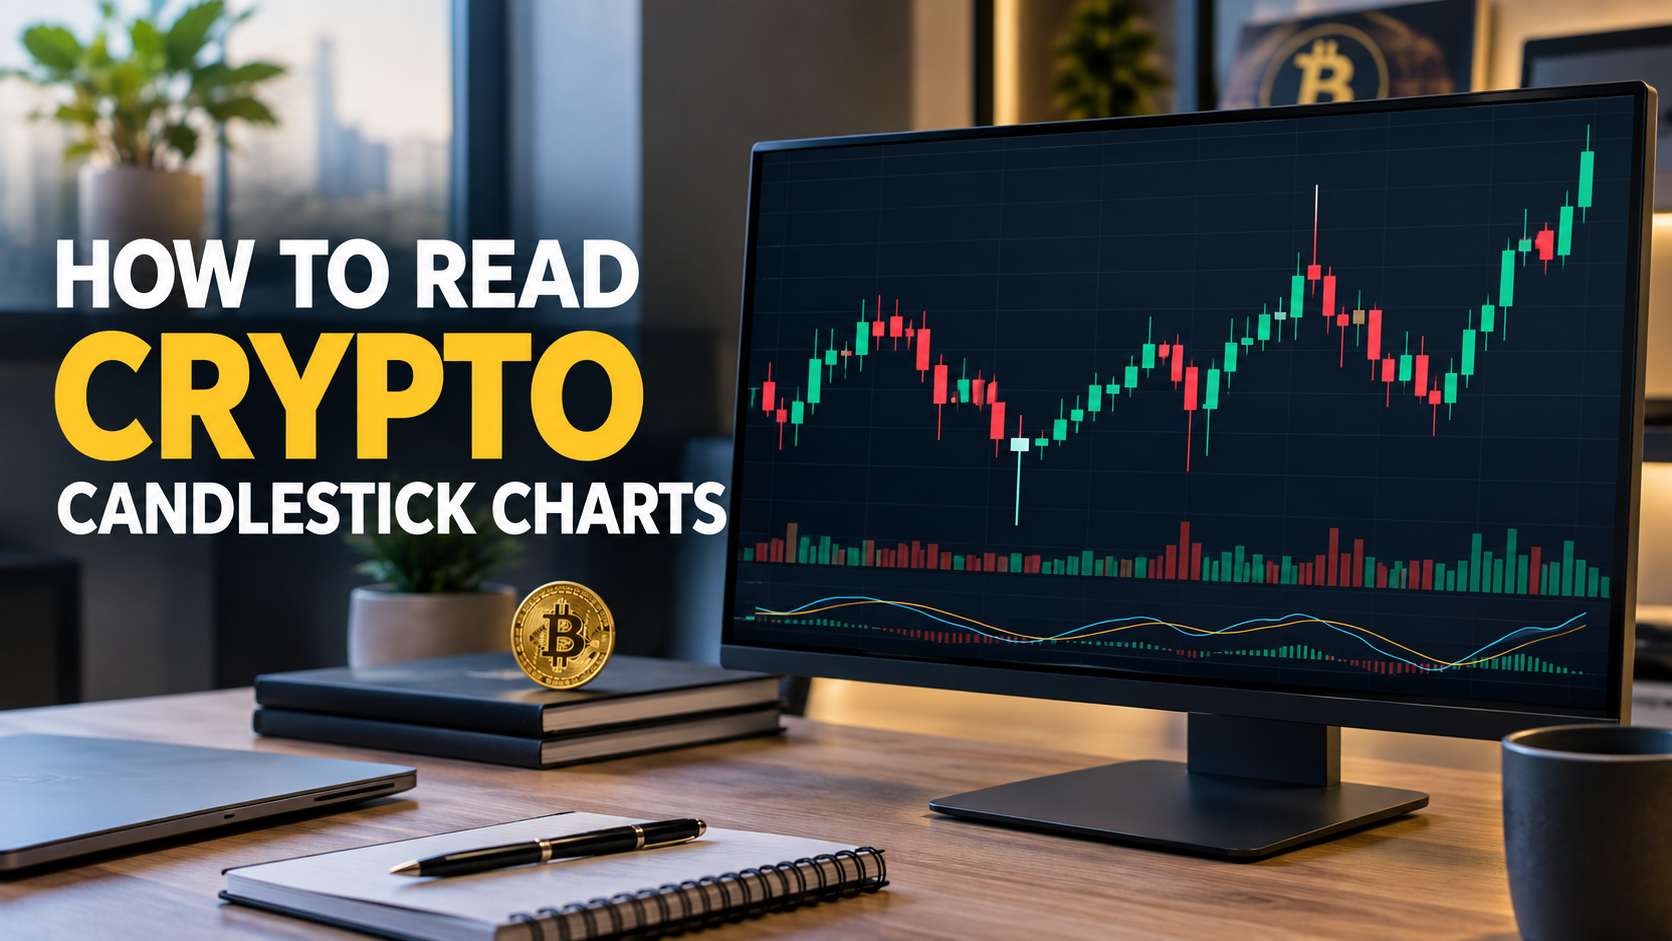
You open your exchange app, pull up Bitcoin, and there it is. A wall of tiny green and red candles, some high, some low, some with tiny little spikes protruding from both ends like antennas. It is no surprise that people are frozen the first time they encounter it. Once you know how to read crypto candlestick charts, that wall stops looking like noise. It’s just information, stacked one piece at a time.
Every one of those bars is a candle. Each candle represents a snapshot of price movement over a specific period, which could range from a minute to an entire day, and the exact duration does not matter. Get the hang of reading one candle, and you’ve basically got all of them figured out.
What a Single Candle Is Telling You
Each candle crams four numbers into one shape. Open, close, high, low, all covering whatever window you picked. Set your chart to daily and each candle covers a full day. Switch to hourly and now you’re looking at sixty minutes at a time instead.
The fat middle part is the body. That’s just the gap between where price opened and where it closed. The skinny lines sticking out above and below are wicks, sometimes people call them shadows, and they show the highest and lowest price the coin hit during that stretch, even if it didn’t stay there.
That’s really the whole trick behind how to read crypto candlestick charts. You’re not looking at a random shape. It is a very short story. The story begins with the starting price, where the price strayed, and where it finished when the candle burned out.
Candlestick Chart Body and Wicks, Broken Down
Most beginners get tripped up right here, so it’s worth slowing down. A long body means price moved a lot during that window, up or down, doesn’t matter which direction. A short, stubby body means buyers and sellers basically fought to a draw and price barely budged either way.
Wicks tell a different part of the story. A long upper wick means price shot up during that stretch but got shoved back down before the candle closed out. Sellers won that fight. A long lower wick means the opposite happened, buyers stepped in and dragged the price back up after it dropped.
Barely any work at all usually just means whatever direction the candle moved, it kept moving that way pretty much the whole time without much pushback.
Bullish and Bearish Candles: Green vs. Red
The color’s a simple rule once you know it. Bullish and bearish candles get their color from where the price ended up compared to where it started. Close higher than the open, and the candle turns green that’s bullish. Close to the open, and it turns red; that’s bearish.
Some platforms swap green and red for white and black instead, so check the legend the first time you’re on a new exchange. And keep in mind the color doesn’t explain why the price moved. It just tells you who won by the time the candle closed.
Watch enough green and red candles crypto traders stare at all day, and a bigger picture starts forming. A run of mostly green usually means buyers have had control for a while. Flip to mostly red, and sellers have been running the show instead.
Common Crypto Candlestick Patterns
After getting comfortable with the single candles, the next level is recognizing recurring candlestick formations in cryptocurrencies. It is not necessary to remember all candlesticks that exist. Only a few candlesticks account for most of the situations that you might encounter.
Take the doji. Barely anybody at all, just a thin line where open and close landed almost on top of each other. Usually shows up when buyers and sellers are stuck in a standoff, and it tends to pop up right before a trend flips.
A hammer has a small body near the top with a long lower wick, and it likes to show up after a drop, hinting buyers just stepped back in. Flip that around and you get a shooting star, a small body near the bottom with a long upper wick, usually showing up after a climb, hinting sellers just took the wheel.
None of these are guarantees, by the way. Clues, not promises. If you want a deeper walk through spotting these on real charts, our candlestick pattern guide breaks each one down with actual examples.
Choosing the Right Crypto Chart Timeframes
The same exact coin can look like a totally different animal depending on which crypto chart timeframes you’re staring at. A one-minute chart might look like pure chaos, flipping green and red every few seconds. Zoom out to daily candles on that same coin, and suddenly there’s a clear trend building over weeks.
Day traders tend to live on the short stuff, sometimes as tight as one or five minutes, because they’re in and out of trades fast. Somebody holding for weeks or months usually cares a lot more about daily or weekly candles, since all that short-term noise doesn’t really touch their plan.
New to this? Daily candles are a good place to start. Less noise, and you’ll actually have time to think through what you’re seeing before the next one closes. Once reading a chart starts feeling second nature, our crypto trend breakdowns can help you put it to use on whatever coin’s got your attention.
Crypto never sleeps, unlike the stock market, so these charts don’t take weekends off either. That round-the-clock volatility is exactly why Investor.gov and the CFTC keep telling people to size their trades carefully before jumping in.
FAQ
What’s the fastest way to learn how to read crypto candlestick charts?
Choose one coin, one time frame, such as daily Bitcoin candles, and simply observe it for about two weeks. Match what’s happening in the news to what the candles are doing. It clicks a lot faster once you connect it to something real.
Do candlestick patterns actually work for crypto?
They are used as indications of market sentiment, but not as a guarantee of what is going to happen next. Cryptocurrencies depend on both information and sentiment equally as much as technical formations, so do not treat candles as the only solution.
What timeframe should beginners use?
Daily candles, most of the time.Quieter than one minute, and you get enough time to look at each one before another pops up.
Why do some candles have no wicks at all?
This simply means that the price did not deviate from the high-low range during that period. The high and low matched the open or close exactly, so there’s nothing left to show as a wick.
Is a green candle always a good sign?
Not really. One green candle just means the price closed a bit higher than it opened during that one window. Doesn’t tell you what’s coming next, so don’t put too much weight on a single candle by itself.